Risk Aggregation IBM Research
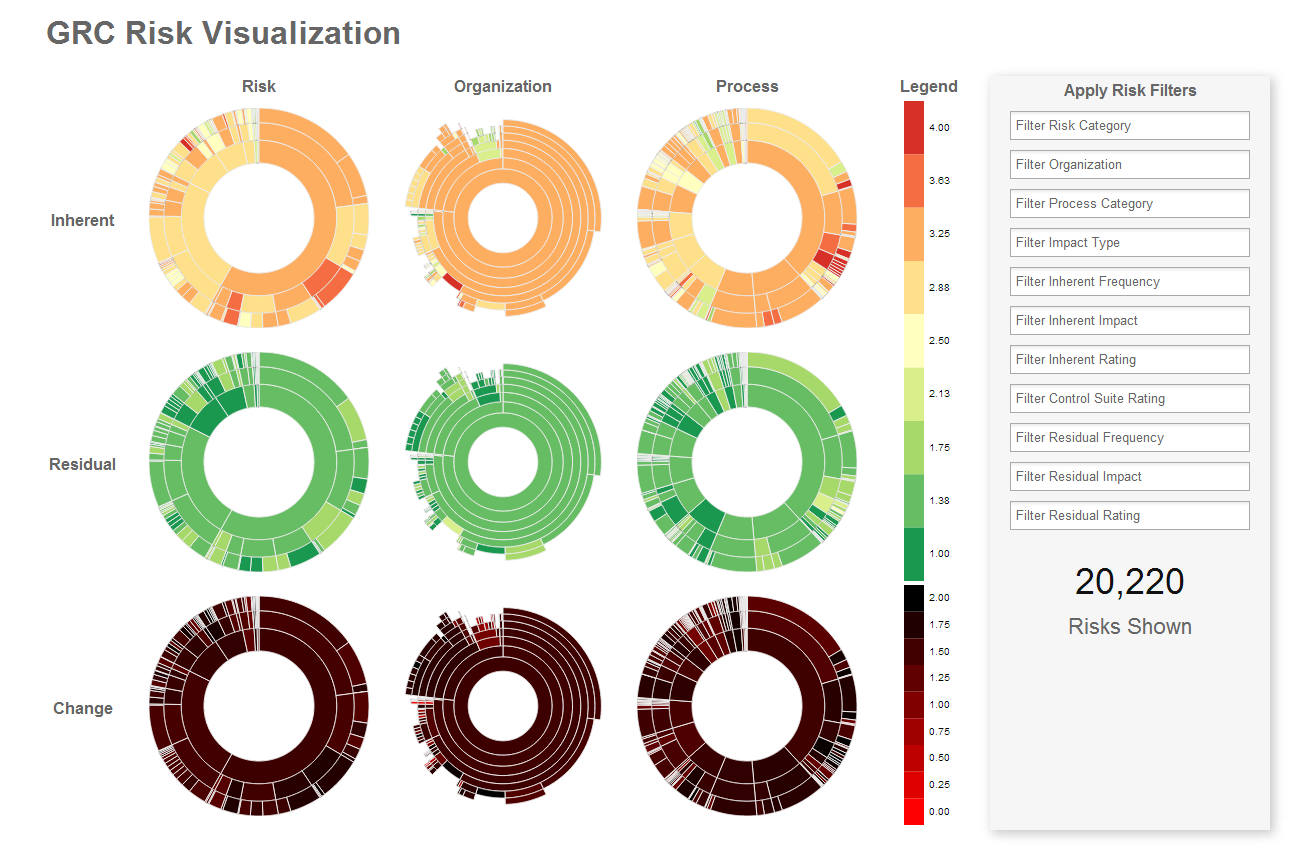
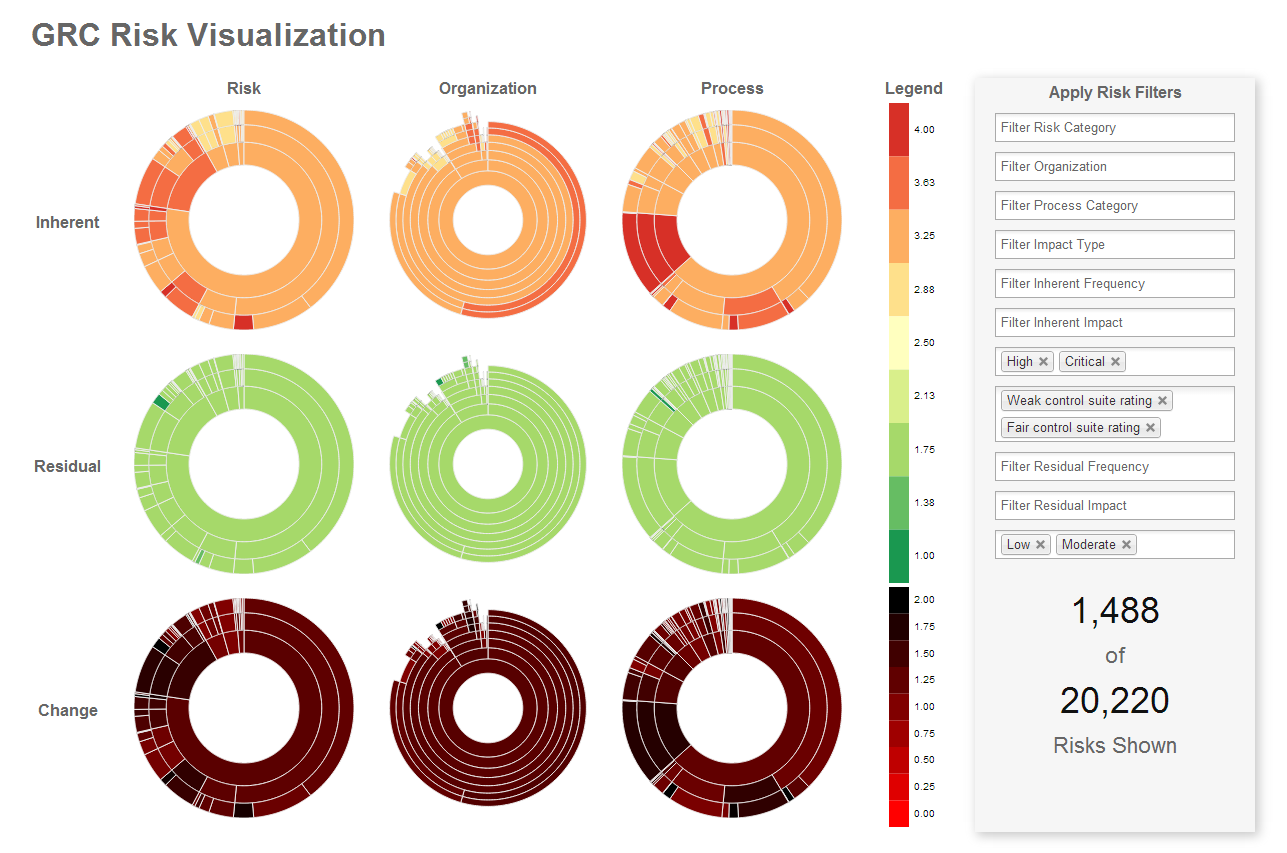
In this follow-on to my work on Risk Visualization and Simulation I looked at how to visualize the aggregated risks of a large enterprise. Synchronized SunBurst visualizations show the relative risks within the organization hierarchy and two additional taxonomies. The aggregate inherent and residual risk ratings are shown, along with the change from inherent to residual. Passing the mouse over a wedge shows detailed information (not shown for client privacy). You can drill down by clicking on a wedge or by using the additional filters offered.